
 In a sport that involves as much maximum effort and intensity as hockey, NHL teams are at a pretty big disadvantage when having to play for the second straight night.
While Major League Baseball teams play pretty much every day throughout the season, they’re used to it. Chewing gum/tobacco/sunflower seeds, sprinting for the odd ball on defense, scratching your jock and taking 10 swings in a game isn’t quite as draining as playing the close-to-30 minutes of NHL hockey that a top defenceman might see.
And though basketball teams sometimes have to play back to backs, they can limit the minutes played by stars (the growing tendency to sit players for the front or back end of back-to-backs has actually become a contentious issue in the NBA) or slow the pace down when they’re on offence.
Hockey teams don’t have that luxury. If you don’t skate fast with the puck, you’ll get pasted into the boards, the other team will skate the puck and play will head the other way.
But just how much impact does playing on no rest have on a team’s chances of winning a game?
In this article, we’ll look at how much teams’ winning percentages drop when playing the second game of back-to-backs and try to determine just how much stock you should be putting in the rest/no rest factor.
NHL Teams’ Records In Back-To-Backs Are Slightly Worse Than Usual
In a previous article about the NHL’s best and worst teams in back-to-backs in 2016-17, we broke down how each team fared on 0 days rest, compared to their performance after having the previous day off.
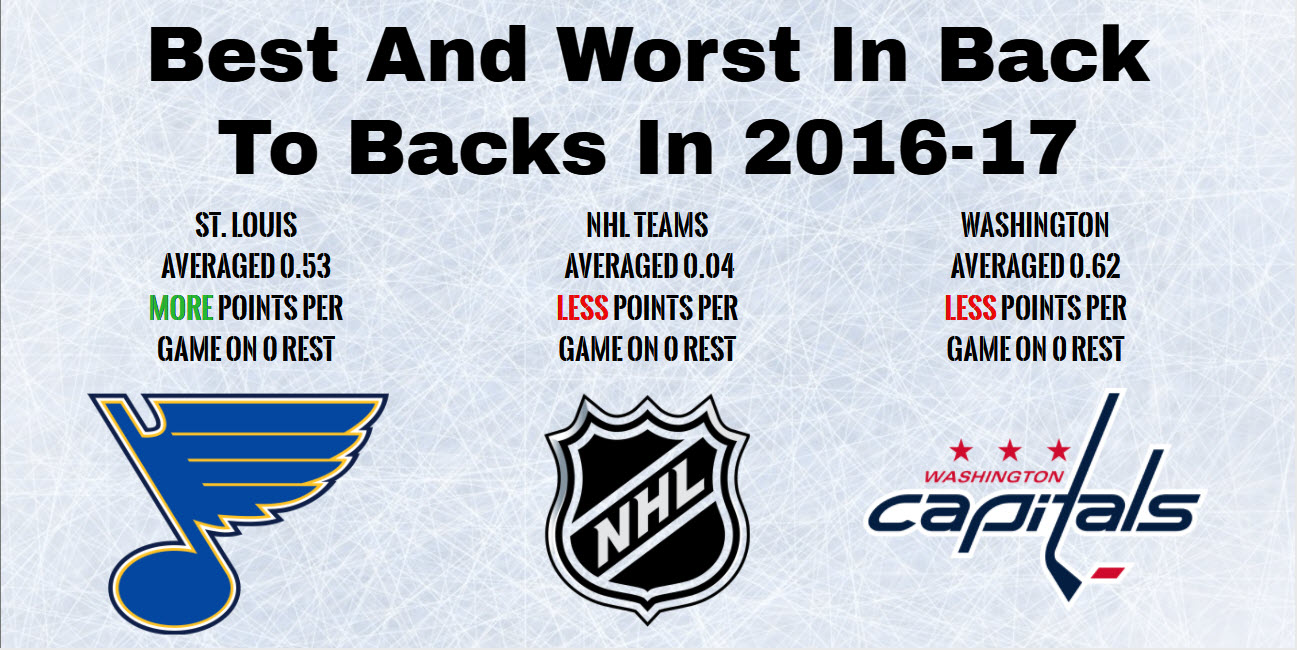
The St. Louis Blues were a remarkable 10-2 on the back end of back-to-backs, while the Washington Capitals were a mediocre (by their standards) 7-8-1 without at least one day off to prepare.
Collectively in 2016-17, however, NHL teams averaged 0.04 less points per game when playing for the second straight night than they did when playing on one or more days rest.
It was the fifth straight year that NHL teams posted a lower point percentage in the second game of back-to-backs than they did when playing with a day or more of rest (we only went back five years for this study), and that -0.04 differential was the lowest of the five. In three of the five seasons we looked at, the difference was in double digits, including a -0.18 disparity in 2014-15.
Playing for the second straight night is an obvious disadvantage for several reasons. However, it’s also obvious that the disadvantage can be overcome in the right circumstances.
Why Were The Blues So Good In Back To Backs In 2016-17?
What’s a bit confusing about the Blues’ success in back-to-backs, at least at first glance, is that St. Louis hadn’t been a strong team in that spot in the previous four years.
Though the Blues were 8-4 when playing for the second straight night in 2015-16, that points percentage was a moderate improvement from the 41-28-9 record they posted otherwise. And over the previous 3 years, St. Louis was a mediocre 16-17-4 in its second game of back-to-backs, a terrible record when compared to its 116-45-12 mark when playing with at least one day of rest.
So what changed in 2016-17? Well, let’s take a look at each of the times the Blues played on consecutive days.
- Oct. 13: Beat Minnesota 3-2 in St. Louis: The Blues were -115 favourites and playing their second game of the season, while Minnesota was making its season debut. St. Louis came out flying in its home opener, outshooting the Wild 14-2 in the first period and 31-21 on the night. #1 goalie Jake Allen played for the second straight night.
- Nov. 6: Beat Colorado 5-1 in St. Louis: The Blues were -165 favourites and started Allen, who had the previous night off. St. Louis didn’t have to travel after playing at home the previous night, but Colorado did have to travel after visiting Minnesota. St. Louis outshot the Avs 28-23.
- Nov. 10: Lost 3-1 at Nashville: The Blues were +125 underdogs and started backup Carter Hutton. St. Louis had to travel from Chicago, while Nashville had the previous day off. Nashville started Pekka Rinne and outshot St. Louis 28-24.
- Nov. 23: Lost 4-3 at Washington: The Blues were +165 underdogs and started Hutton again. St. Louis had to travel from Boston, while the Capitals had the previous two days off. Washington started Braden Holtby and outshot St. Louis 25-21.
- Dec. 9: Beat New Jersey 4-1 at New Jersey: The Blues were -140 favourites and started Allen for the second straight night. New Jersey started backup Keith Kinkaid in net and had further to travel, having visited Montreal the previous night while St. Louis took the one-hour bus ride from Brooklyn. The Blues outshot New Jersey 31-21.
- Dec. 20: Beat Dallas 3-2 in OT in Dallas: The Blues were +115 underdogs and started Allen in net. St. Louis was outshot 38-22 on the night (including 14-7 in the first period) by the Stars, who had been off the previous 2 days. The Blues had to travel from St. Louis.
- Jan. 15: Beat Anaheim 2-1 in OT in Anaheim: The Blues were +150 underdogs and gave Hutton his fourth start in five games as Allen was struggling. St. Louis travelled from San Jose while the Ducks also played the previous night and had to travel from Arizona, basically the same distance. St. Louis outshot Anaheim 25-23.
- Feb. 7: Beat Ottawa 6-0 in Ottawa: The Blues were +125 underdogs and gave Allen his fourth start in five games after he won back the starting job. Ottawa started Andrew Hammond in net after starting Mike Condon in its previous 24 games, and the shots on goal were 30-30. St. Louis played in Philadelphia the previous day.
- Feb. 16: Beat Vancouver 4-3 in St. Louis: The Blues were -175 favourites and started Allen after sitting him in a 2-0 win the previous day in Detroit. Vancouver started backup Jacob Markstrom as it played the final game of a 6-game road trip. Shots on goal were 21-21.
- March 11: Beat New York Islanders 4-3 in St. Louis: The Blues were -115 favourites and started backup Hutton. The Islanders had the previous day off but were playing their 9th consecutive road game, and St. Louis was home the previous day and didn’t have to travel. The shots were 24-24.
- March 16: Beat San Jose 4-1 in San Jose: The Blues were +165 underdogs and started Hutton after losing 2-1 the previous night in Anaheim. The Sharks started backup Aaron Dell but were well rested, and St. Louis outshot San Jose 36-20. Hard to take much away from this Blues effort.
- April 9: Beat Colorado 3-2 in St. Louis: The Blues were whopping -210 favourites and gave Allen the start. Colorado had also played the previous day and though the Avs started #1 goalie Calvin Pickard, they had won just 1 road game since Dec. 23. Colorado outshot the Blues 34-27 and led 2-1 after two periods.
To summarize, of the Blues’ 10 wins when playing for the second straight day:
- 6 came by one goal (including two in overtime)
- 5 came against backup goalies
- 8 came with the Blues playing their #1 goalie at the time
- 5 came when they failed to outshoot their opponent
- 2 came when they didn’t have to travel between games
- 6 came against non-playoff teams, including 2 against the awful Avalanche
- 7 came with their opponent at a scheduling disadvantage (playing the previous night, at the end of a long road trip or playing their first game of the season).
Against teams that made the playoffs in 2016-17, the Blues were 4-2 when playing the second game of a back-to-back. And against well-rested opponents starting their top netminder (let’s exclude teams playing the final game of long road trips, since that’s an extreme fatigue spot), the Blues were 1-2, with the win coming against a team playing its first game of the year.
Why Were The Capitals So Bad In Back To Backs In 2016-17?
First, let’s get this straight: Technically, the Capitals weren’t that awful on the second night of back to backs.
It’s just that the 0.94 points per game they averaged in that situation was such a massive dropoff from the stellar 1.56 points per game they earned when playing with 1 or more days rest.
So why were the Caps a sub-.500 team when playing on consecutive nights? The previous season, the Caps were 9-5-1 on 0 days rest, ranking in the middle of the league when it came to point percentage drop-off in that situation. Washington also posted a winning record in back-to-backs in 2013-14 and 2012-13.
Let’s break down each of the Caps’ results on 0 days rest last year:
- Oct. 30: Beat Calgary 3-1 in Calgary: The Capitals were -135 favourites and started Braden Holtby. Calgary started #1 netminder Brian Elliott and had the previous day off.
- Nov. 12: Lost 5-1 at Carolina: The Capitals were -135 favourites and started backup Philip Grubauer after Holtby played in a 3-2 OT win the previous night in Chicago. Carolina started #1 goalie Cam Ward and had the previous day off. The Hurricanes outshot Washington 16-6 in the first period and 38-21 on the night.
- Nov. 16: Beat Pittsburgh 7-1 in Washington: The Capitals were +105 underdogs and started Holtby after Grubauer lost 2-1 in OT the previous night in Columbus. Pittsburgh started #1 goalie Matt Murray and was playing with 3 days rest.
- Nov. 26: Lost 4-2 at Toronto: The Capitals were -108 favourites and started Holtby. Toronto started #1 goalie Fredrik Andersen and had the previous 2 days off.
- Dec. 17: Lost 2-1 to Montreal in Washington: The Capitals were -140 favourites and started Holtby. Montreal had also played the previous day, but still started #1 goalie Carey Price.
- Jan. 1: Beat Ottawa 2-1 in Washington: The Capitals were -180 favourites and started Holtby. Ottawa had the previous 2 days off and started #1 goalie (at the time, since Craig Anderson was on leave) Mike Condon.
- Jan. 16: Lost 8-7 in OT in Pittsburgh: The Capitals were +125 underdogs and started Holtby, though he was pulled for Grubauer in the second period. Pittsburgh started #1 goalie Matt Murray, had the previous day off and was eager to snap a 3-game losing streak.
- Jan. 24: Lost 3-0 in Ottawa: The Capitals were -125 favourites and started Grubauer. Ottawa started #1 goalie Condon and had the previous day off. Washington played the previous day in Carolina.
- Feb. 1: Beat Boston 5-3 in Washington: The Capitals were -150 favourites and started Holtby. Boston started #1 goalie Tuukka Rask for the second straight night.
- Feb. 5: Beat Los Angeles 5-0 in Washington: The Capitals were -160 favourites and started Grubauer. LA started #1 goalie Peter Budaj.
- Feb. 19: Lost 2-1 at New York Rangers: The Capitals were -105 underdogs and started Grubauer. New York started #1 goalie Hendrik Lundqvist and had the previous 2 days off, while Washington was coming off a 3-2 shootout loss in Detroit.
- Feb. 25: Lost 5-2 at Nashville: The Capitals were +105 underdogs and started Grubauer. Nashville started backup goalie Juuse Saros and had the previous day off.
- March 12: Lost 5-2 at Anaheim: The Capitals were -135 favourites and started Holtby. Anaheim started #1 goalie (at the time, since John Gibson was injured) Jonathan Bernier and had the previous day off, while Washington was playing its third west coast game in four nights.
- March 29: Won 5-3 at Colorado: The Capitals were -265 favourites and started Grubauer. Colorado started #1 goalie Calvin Pickard and had been off the previous day.
- April 5: Beat New York Rangers 2-0 in Washington: The Capitals were -210 favourites and started Holtby. New York started #1 goalie Lundqvist and had the previous two days off.
- April 9: Lost 2-0 to Florida in Washington: The Capitals were -200 favourites and started Holtby, though he was pulled after two periods to rest. Florida played the previous night but still started #1 goalie James Reimer. Washington sat five regulars in a regular-season finale that had no playoff implications.
To summarize, of the Capitals’ 9 losses (including overtime) when playing for the second straight day:
- 8 came against their opponent’s #1 goalie
- 7 came when their opponent had the previous day off
- 9 came when the Capitals had to travel after playing the previous day
- 7 came against teams that made the playoffs
- 7 came on the road
- 4 came with backup Grubauer in net
It’s interesting that of the 16 games Washington played on 0 rest, their opponent play their backup goalie just once. That’s the price you pay for being the best regular-season team in the NHL: opponents will never take you lightly, and you’ll always take their best shot.
So How Much Does Playing Back To Back Impact Win Probability?
Over the past five years, NHL teams have averaged .108 fewer points per game when playing for the second straight night than they have when playing on one or more days rest. Earning .108 less of a possible two points represents about a 5% decrease in point production, and theoretically a 5% downgrade in win probability.
However, as we illustrated above, there are tons of other factors that you need to consider before determining how much of a disadvantage a team is at when playing on consecutive nights.
Make sure you look to see whether their opponent is also playing for the second straight night, how much travel was involved for both teams, how good their opponent is, who’s starting in net, and even if there are any motivational factors like emotional letdowns or revenge.
Just because the Blues earned 20 of a possible 24 points when playing on 0 days rest in 2016-17 doesn’t mean they’re in way better shape than any other team, or that they’ve magically cracked the code of what it takes to win the second game of a back-to-back.
And just because Washington struggled in that situation doesn’t mean that Alex Ovechkin needs to spend more time on the treadmill so he’s fresher in games on short rest, or that that trend will continue again next season.
Factor a team’s record in back-to-backs into your handicapping if you’d like, but also be sure to look for any scheduling advantages/disadvantages in the matchup and project who’s starting in net before you place your wager.
NHL’s Back-To-Back Records Since 2012-13
Note: This chart lists the difference in teams’ point-per-game average in games on 0 rest, compared to 1 or more days rest
| Team | 2016-17 | 2015-16 | 2014-15 | 2013-14 | 2012-13 |
|---|---|---|---|---|---|
| -0.34 | +0.01 | -0.18 | +0.37 | -0.14 | |
| 0.00 | -0.27 | +0.20 | -0.20 | -0.34 | |
| -0.54 | -0.15 | -0.52 | +0.20 | -0.60 | |
| -0.35 | -0.07 | -0.24 | -0.07 | -0.25 | |
| -0.17 | -0.52 | +0.36 | -0.03 | -0.24 | |
| +0.22 | +0.40 | -0.30 | -0.21 | +0.26 | |
| +0.21 | -0.13 | +0.03 | +0.26 | +0.18 | |
| +0.16 | +0.23 | -0.41 | -0.42 | -0.41 | |
| -0.07 | -0.05 | -0.25 | +0.13 | -0.49 | |
| -0.30 | -0.39 | -0.24 | -0.50 | -0.37 | |
| +0.20 | -0.54 | -0.16 | 0.00 | +0.39 | |
| +0.16 | -0.33 | -0.35 | -0.18 | -0.07 | |
| +0.26 | +0.03 | -0.13 | +0.24 | -0.35 | |
| -0.06 | +0.45 | -0.43 | -0.09 | +0.16 | |
| -0.09 | -0.24 | +0.20 | -0.15 | +0.21 | |
| +0.09 | -0.08 | -0.11 | -0.20 | +0.40 | |
| 0.00 | -0.59 | -0.63 | -0.17 | -0.08 | |
| +0.19 | +0.07 | -0.15 | +0.21 | -0.23 | |
| +0.05 | +0.22 | -0.05 | +0.05 | -0.79 | |
| +0.17 | +0.01 | +0.14 | +0.26 | -0.18 | |
| -0.05 | -0.57 | -0.25 | -0.25 | +0.23 | |
| +0.12 | -0.29 | -0.20 | +0.25 | +0.21 | |
| -0.27 | -0.34 | -0.25 | +0.03 | -0.39 | |
| -0.03 | +0.10 | +0.11 | +0.06 | -0.34 | |
| +0.53 | +0.04 | -0.23 | -0.60 | -0.40 | |
| +0.12 | -0.31 | -0.75 | +0.22 | -0.37 | |
| -0.56 | -0.27 | +0.15 | -0.34 | -0.21 | |
| -0.11 | +0.20 | -0.46 | -0.01 | +0.06 | |
| -0.62 | -0.24 | -0.36 | +0.02 | +0.07 | |
| +0.02 | -0.23 | +0.01 | -0.36 | -0.34 | |
| League Average | -0.04 | -0.13 | -0.18 | -0.05 | -0.14 |